Figure 8.
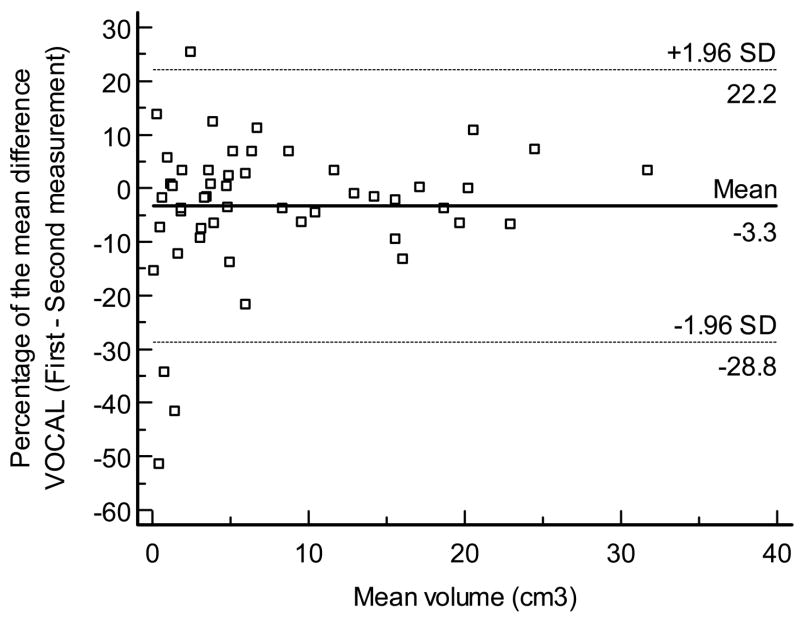
Figure 8a. Bland and Altman plot for the percentage of the mean difference and 95% limits of agreement for intra-observer measurements performed by VOCAL™
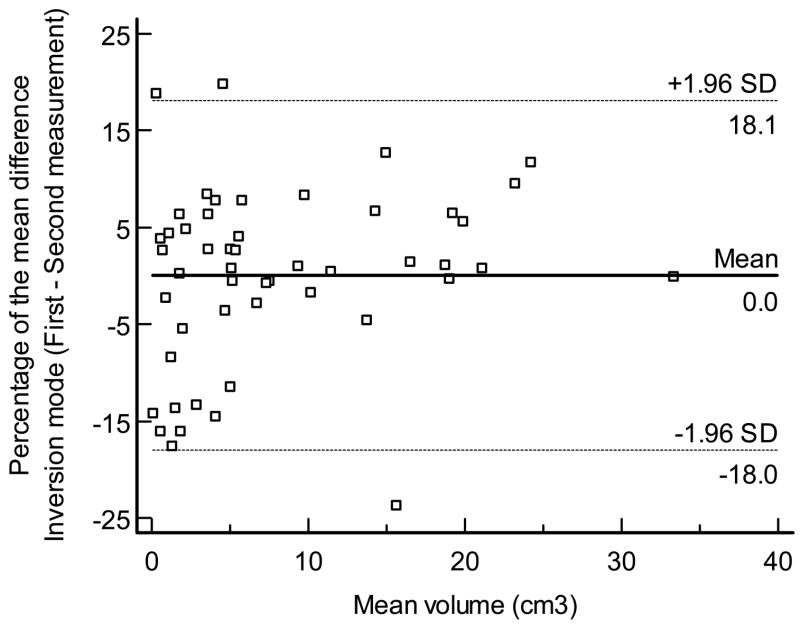
Figure 8b. Bland and Altman plot for the percentage of the mean difference and 95% limits of agreement for intra-observer measurements performed by inversion mode.
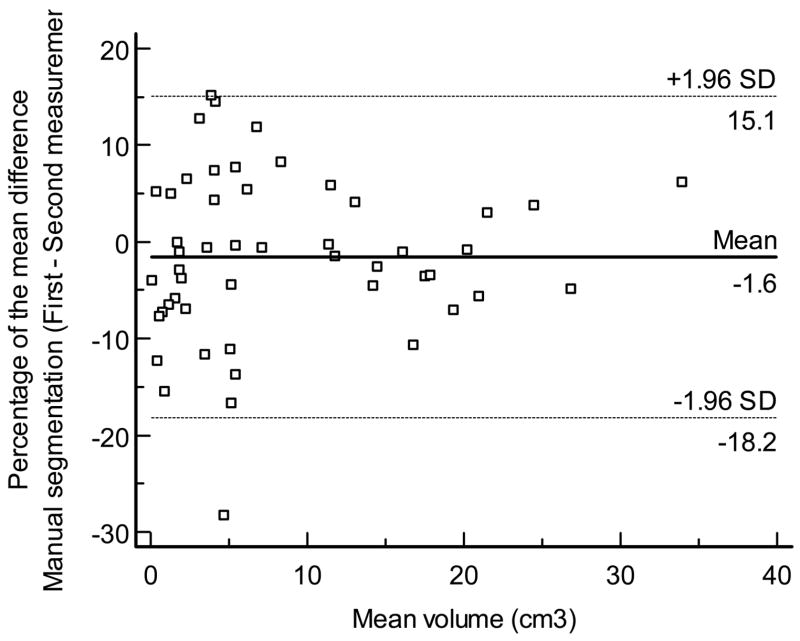
Figure 8c. Bland and Altman plot for the percentage of the mean difference and 95% limits of agreement for intra-observer measurements performed by manual segmentation.


