
Fig. 3.
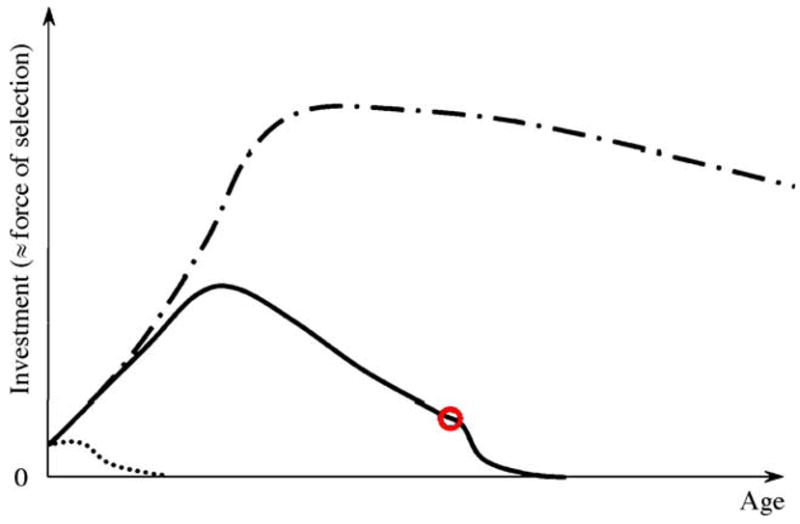
Representation of the investment embodied in honey bee workers. Patterns during the favorable and unfavorable season are depicted by full and dash-dotted lines, respectively. The red circle identifies the relative time of onset of foraging. The dotted line exemplifies the investment in a bee that receives little or no proteinacious jelly after emergence. The dynamics match the relative vitellogenin concentrations of the bees accurately (e.g., Engels and Fahrenhorst, 1974; Fluri et al., 1982; Amdam et al., 2004a).