Figure.
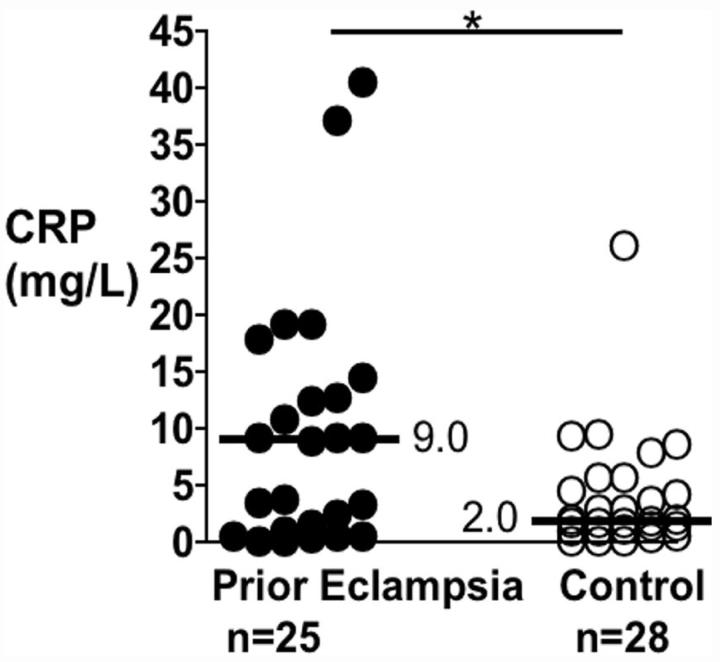
Scatterplot of serum C-reactive protein (CRP) concentrations in postmenopausal women with a history of eclampsia (prior eclampsia) or history of uncomplicated pregnancy (control). Each symbol corresponds to a different individual. Thick horizontal bars with adjacent numbers indicate median values for each group. *P<0.03.

