
Fig. 6.
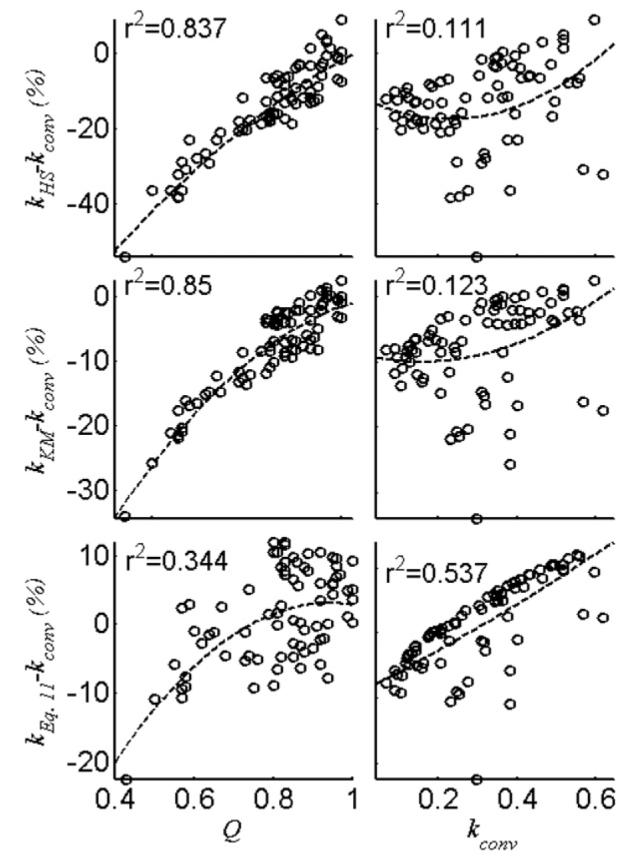
Percent adjustment made to kconv by kHS, kKM and kEq. (11) (using FAST* coefficients from Table 4) as a function of Q and kconv for the 113 individual slice FAST data from the 14 normal controls (38 spectra) and 34 patients (75 spectra) with Q ⩽ 1. Best-fit second-order curves are shown (dashed line) with the coefficient of determination, r2.