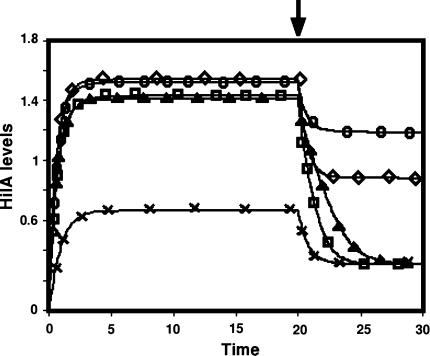
Fig. 3.
The kinetics of HilA protein The basal behaviour of the five models. At the time point indicated by the arrow, the HilD level was set to 0. (×, Model 1; Δ, Model 2; ○, Model 3; □, Model 4; and ◊, Model 5). The X-axis shows the time in arbitrary units while the Y-axis shows the level of HilA in arbitrary units

