
Fig. 1.
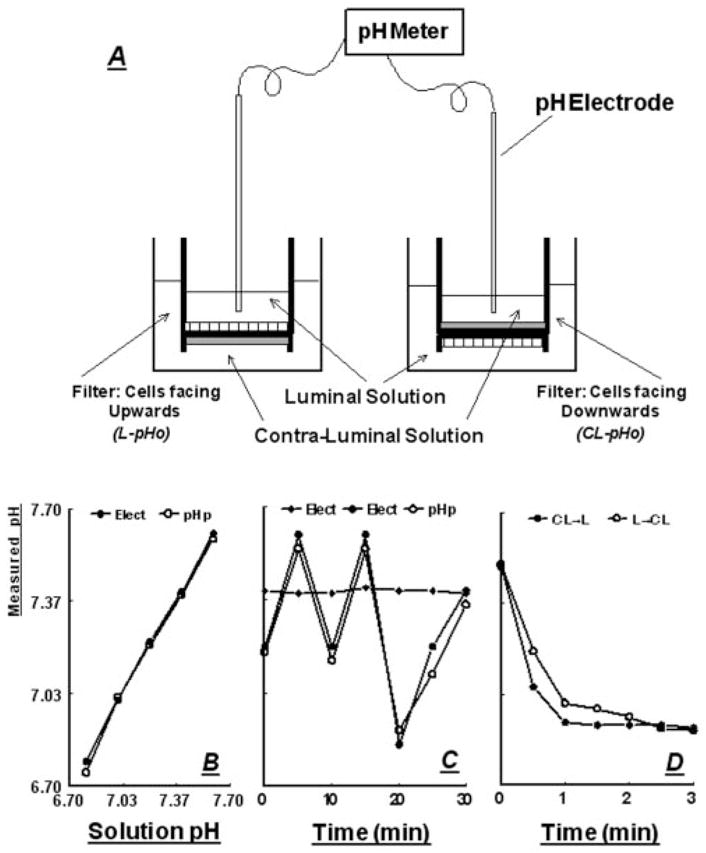
A, Schema of the experimental system for determinations of L-pHo (left) and CL-pHo (right) across cultured epithelial cells. Epithelial cells are shown as hatched bars and fibroblasts as gray bars. B, Correlation of pH measurements using the pH electrodes (Elect) and pH paper (pH p) in standard pH solutions. C, Filled diamonds, stability of pH recordings using blank filter (without cells) in a setup as in A; circles, pH measurements using the pH electrodes (Elect, filled circles) and pH paper (pH p, open circles) in a blank filter after pH was changed by adding aliquots from 0.1 N NaCl or 0.1 N HCl. D, Filled circles, pH measurements in a blank filter using the pH electrode (placed in the luminal [L] compartment) after acidification of the contraluminal solution (filled circles, CL → L); open circles, pH measurements in a blank filter using the pH electrode (placed in the contraluminal [CL] compartment) after acidification of the luminal solution (filled circles, L → CL). Acidification in the cis compartment was induced by adding aliquots of 0.1 N HCl.