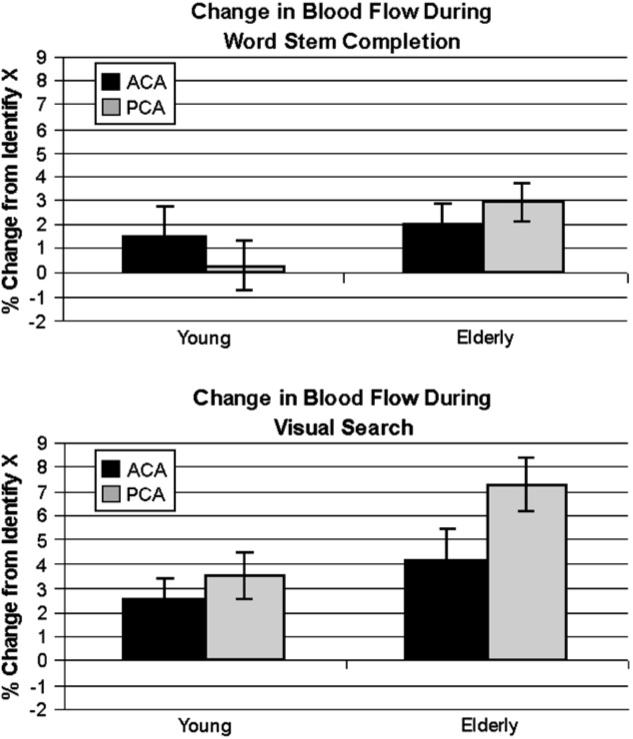
Fig. 2.

The bars reflect the mean percent change in BFV relative to an “IDX” baseline task in ACA and PCA territories in young and elderly participants. Error bars represent the standard error of the mean. The top panel shows changes during the WSC task where participants are asked to generate as many completions to a given three letter stem as possible and indicate with a button press whether a completion came to mind. There was no main effect of group or location, but there was a significant interaction. The bottom panel shows changes during the VS task where participants were asked to indicate with a button press the presence of a line bisecting a circle among a random array of circles. There was a trend towards a main effect of group, but no effect of location or interaction.
