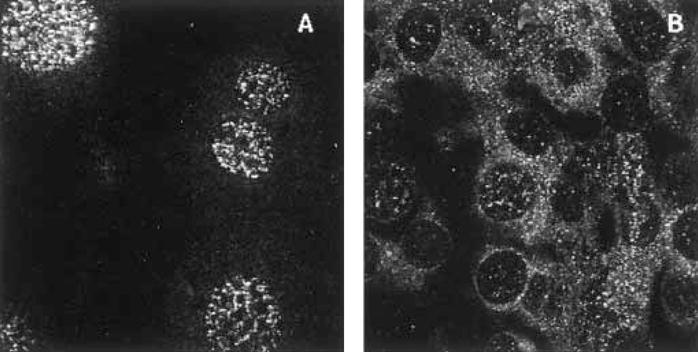
Fig. 1.

The effect of LCMV infection on the subcellular distribution of the cell cycle marker PCNA. Panels A and B show uninfected and infected NIH 3T3 cells respectively. Cells were infected with 1 plaque forming unit per cell of LCMV Armstrong for 100 h as described previously [18]. The images were collected on a Leica con-focal laser microscope. Magnification was 100X.
