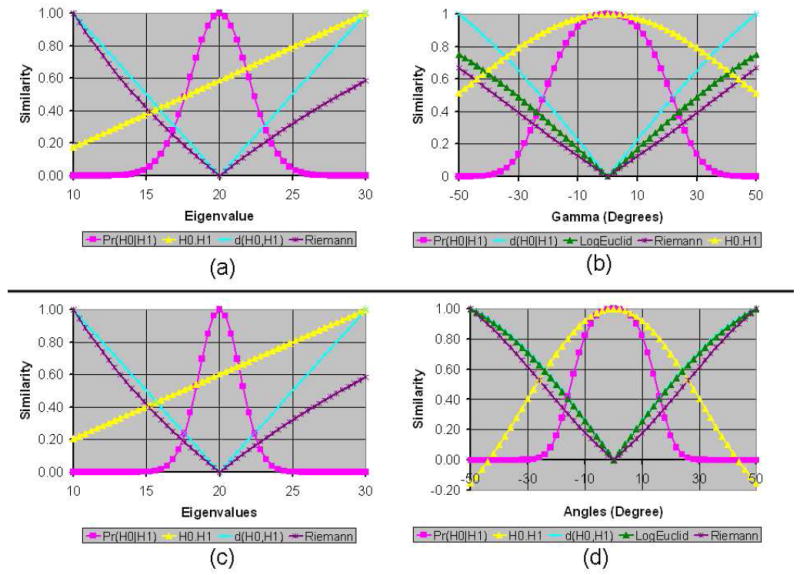
Figure 1.

Graphs of Various Similarity Measures for between the unperturbed tensor and the perturbed tensor. The perturbed tensor was obtained from the unperturbed tensor by (a) only varying the largest eigenvalue from 10 to 30, (b) only varying the angle γ (i.e., rotations around the Z-axis) from −50° to 50°, (c) only varying the largest two eigenvalues by the same amount from 10 to 30, and (d) only varying the angles β (i.e., rotations around the Y-axis) and γ by the same amount from −50° to 50°. The eigenvectors of the unperturbed tensor were aligned along the X-, Y-, and Z-axes, with eigenvalues 20, 10, and 5, respectively. The similarity between tensors was computed using six methods: Pr(H0∣H1), H0 · H1, H0 : H1, d(H0, H1), LogEuclid(H0, H1), and Riemann(H0, H1). For comparison, we scaled the similarity values to lie between 0 and 1 for all of measures. Because the values that were computed using H0 : H1 were close to the values of H0 · H1, for clarity we plotted only the values of H0 · H1. Also, for varying eigenvalues, LogEuclide(H0, H1) values were close to those of Riemann(H0, H1); we therefore plotted only the values of Riemann(H0, H1) for varying eigenvalues. The negatives of distance measures are used as the similarity values between tensors. The graph of similarity values computed using our measure is bell-shaped and symmetric around the point where the perturbed tensor equals the unperturbed tensor.
