
Figure 10.
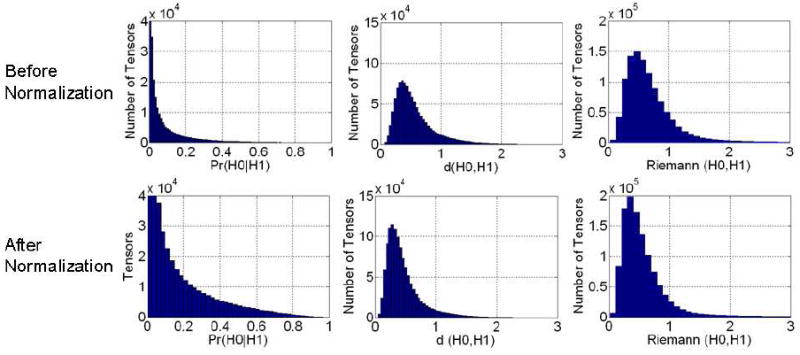
Histogram of Similarity Values at Corresponding Locations across two individual images (Fig. 9) both before and after normalization. We expected the similarity between tensors at corresponding locations to increase significantly following normalization. Histograms in the left column show that after normalization, more tensors were similar across images when similarity was assessed using our measure. In our method, the number of tensors with similarity greater than 0.5 in the normalized images increased by 480 % as compared to those in images before normalization.