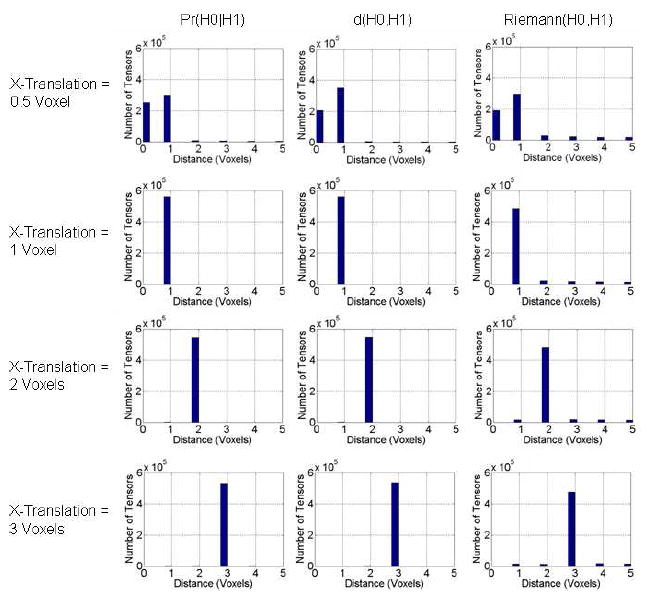
Figure 5. Histogram of Distances Between the Most Similar Tensors Along the X-Axis.

From a single template image, we generated simulated images that were shifted along the X-axis by varying amounts (Fig. 4). We then used one of the three similarity measures, Pr(H0∣H1), d(H0, H1), and Riemann(H0, H1), to find a tensor along the X-axis in the shifted image that was most similar to the unperturbed tensor. We computed the Euclidean distance between the most similar tensors and plotted the histograms. For increasing amounts of translation, the distance between tensors increased, especially when the most similar tensor was searched using our method. Our measure therefore was most sensitive to perturbations in tensors and distinguished better tensors with differing morphologies in neighboring voxels.
