
Figure 8.
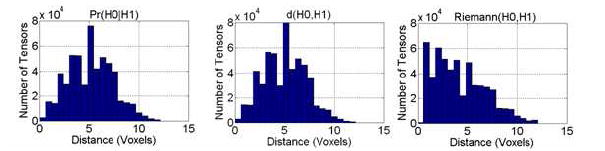
Histogram of Euclidean Distances Between the Most Similar Tensors across the template image and the synthetic image rotated by 5° around the Z-axis. Even for a small amount of rotation, tensors far from the axis of rotation are translated by large amounts. To plot the histogram, we searched for the most similar tensor in a 3D neighborhood 15 × 15 × 15 voxels in size. We computed these histograms for three similarity measures: Pr(H0∣H1), d(H0, H1), and Riemann(H0, H1). As expected, histograms for both Pr(H0∣H1) and d(H0, H1) show a large spread and a peak in the middle of distances between the tensors that are most similar across the images.