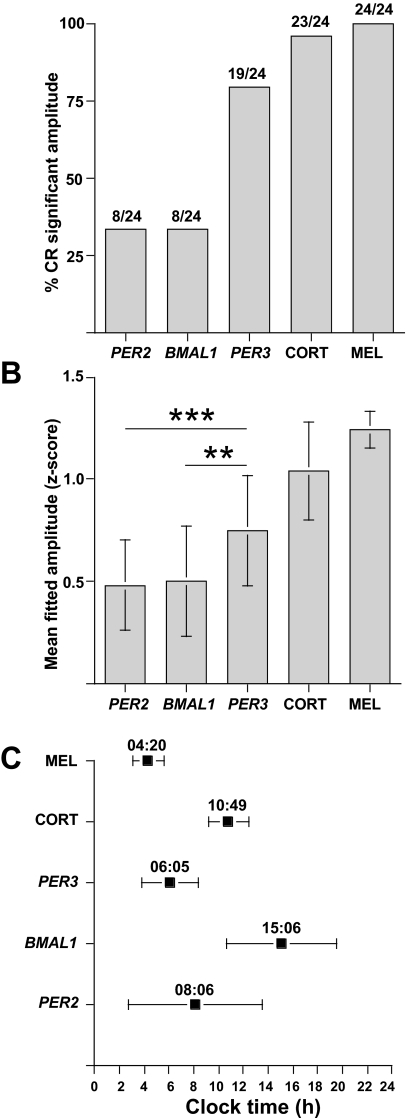
Figure 3.
Characterization of circadian marker rhythms. (A) Percentage of individuals in whom, under constant routine conditions, a significant amplitude could be detected for each circadian marker. The actual number of individuals is shown above each bar. (B) Mean fitted z-score amplitudes (± SD). (C) Mean fitted z-score phase maxima (± SD). **P = 0.0027, ***P = 0.0004. CORT = Cortisol, MEL = Melatonin

