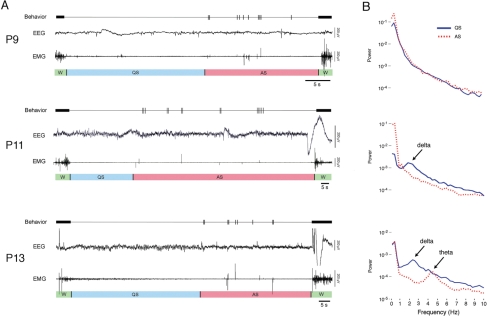
Figure 1.
(A) Representative data from postnatal day (P)9, P11, and P13 rats spanning 1 sleep-wake cycle (W: wakefulness; QS: quiet sleep; AS: active sleep). For each subject, the top trace depicts behaviorally scored coordinated movements (thick horizontal bars) and myoclonic twitches (vertical tics), the middle trace depicts neocortical electroencephalogram (EEG) activity, and the bottom trace depicts nuchal electromyogram (EMG) activity. Behavioral states are indicated beneath each EMG trace. For these examples, only sleep periods comprising 1 QS and AS bout were chosen. (B) Representative spectral analyses of EEG activity during QS (blue) and AS (red). Each power spectrum was produced from 10 AS and QS bouts from a single subject at each age. The first delta-related spectral peak occurred during QS in the P11 subjects.

