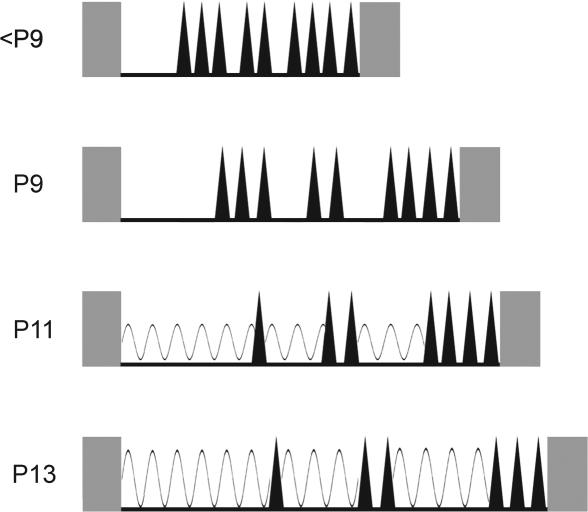
Figure 7.
Schematic depiction of the developmental emergence of delta activity. Grey rectangles represent periods of high muscle tone, indicative of wakefulness. Interposed periods of sleep are defined by nuchal atonia, depicted as black lines. Phasic bursts of myoclonic twitching, indicative of active sleep, are depicted as black triangles. At postnatal day (P)9 and earlier, each sleep period comprises an initial bout of quiet sleep (QS) followed by bursts of phasic activity interrupted by brief bouts of behavioral quiescence. By P11, delta activity (depicted as sinusoidal waves) is detected during the first QS episode as well as during some of the subsequent periods of quiescence between bouts of active sleep (AS). By P13, delta power has increased and is more reliably expressed during periods of behavioral quiescence. Overall, with age, sleep durations increase and the intervals between bouts of AS also increase, thus providing greater opportunity for the expression of delta activity during the final third of a sleep bout.

