
Figure 8.
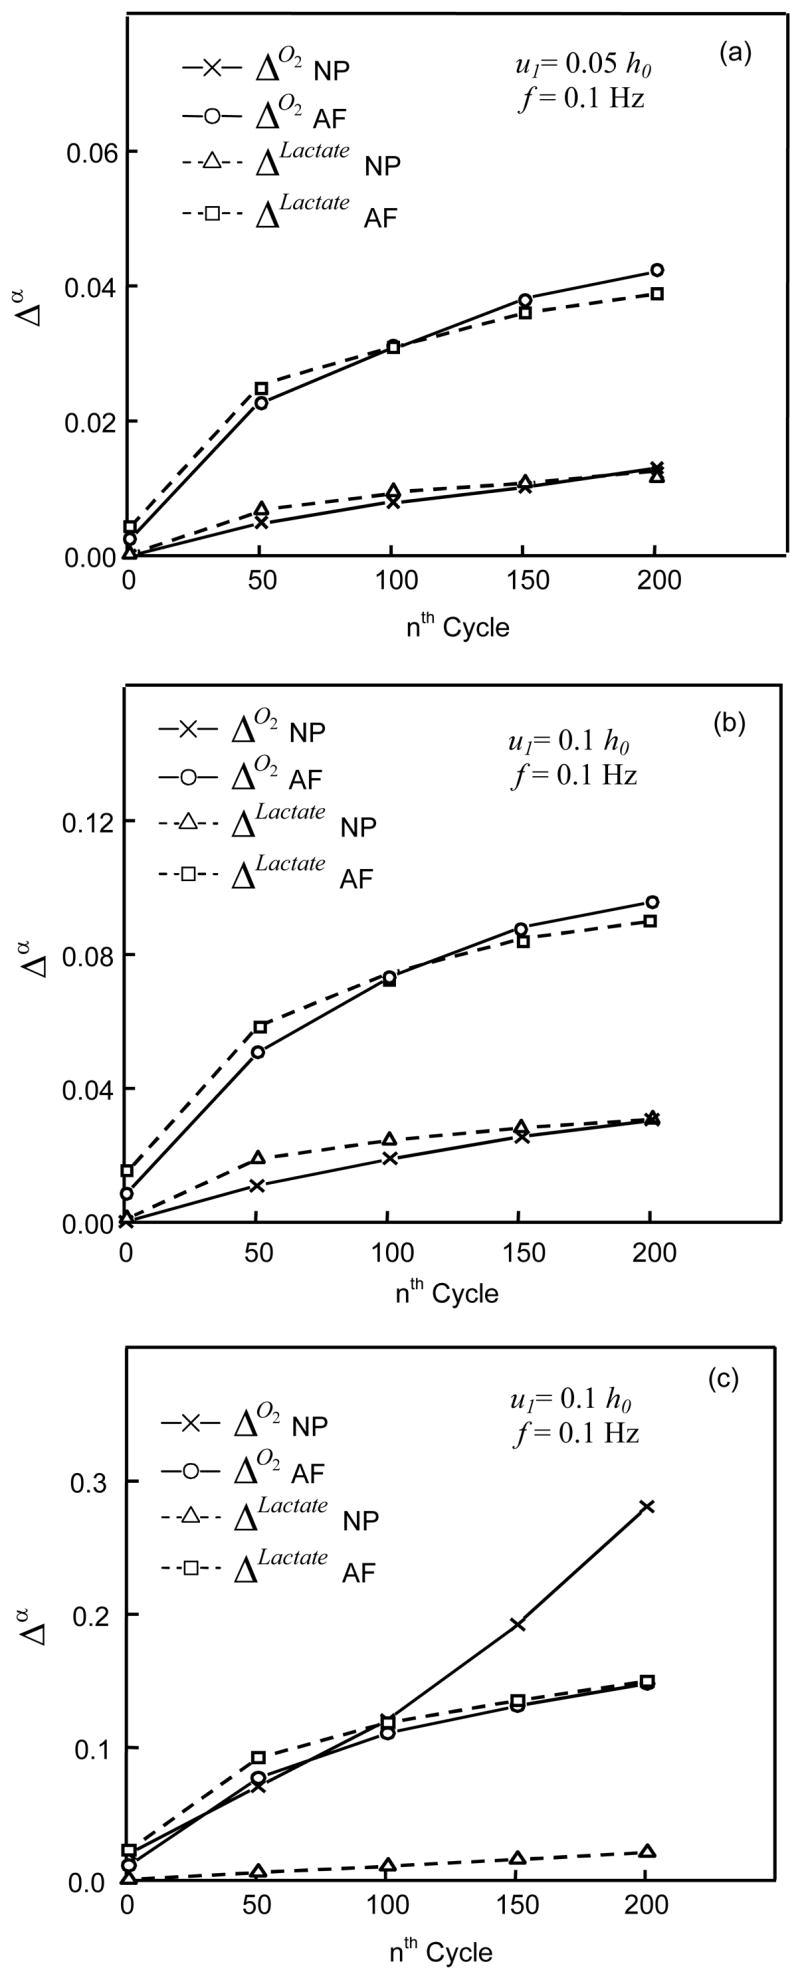
Δo2 and ΔLactate for two different anatomical regions (NP and AF) of IVDs under dynamic loading with the conditions of (a and b) 50% permeable and (c) impermeable endplates. For the dynamic compression test, the loading frequency was 0.1Hz and amplitude was either (a) 2.5% or (b and c) 5% of disc In (b), the Δo2 height increased from 0.03% during the 1st cycle to 3% during the 201st cycle for NP and from 0.9% to 9.6% for AF while the ΔLactate increased from 0.1% during the 1st cycle to 3.1% during the 201st cycle for NP and from 1.5% to 9% for AF. In (c), the Δo2 increased from 2% during the 1st cycle to 28.1% during the 201st cycle for NP and from 1.1% to 15.8% for AF, while the ΔLactate increased from 0.08% during the 1st cycle to 2.1% during the 201st cycle for NP and from 2.2% to 15% for AF