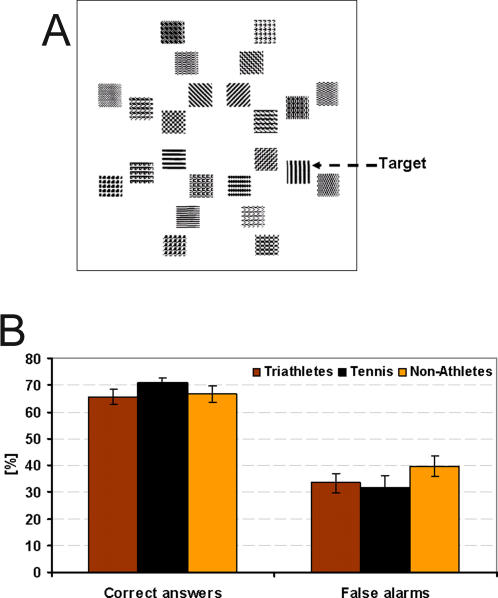
Figure 5. Pattern detection.
A: Stimulus composed of 24 patterns. The target to be detected is shown by the arrow. B: Results of the pattern detection task: Accuracy is shown on the left part of the graph and false alarms are shown on the right part for each group of subjects. Error bars show standard errors.

