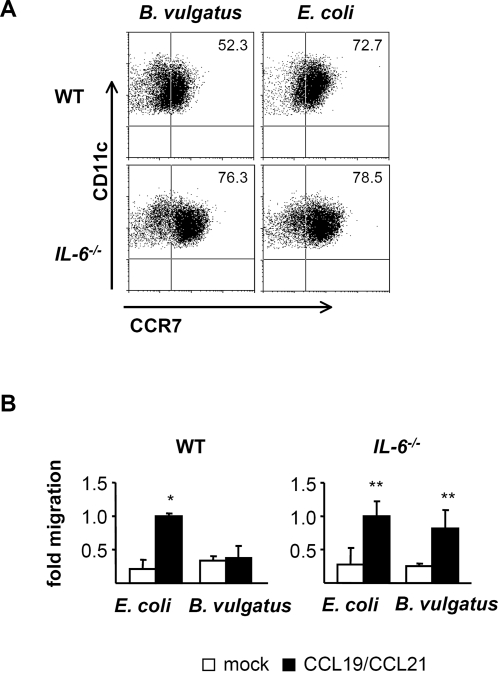
Figure 3. CCR7 expression by and migration of BMDC upon stimulation with B. vulgatus mpk or E. coli mpk.
Analysis of CCR7 surface expression in wild type or IL-6−/−-BMDC upon stimulation with B. vulgatus mpk or E. coli mpk (A). CCR7 surface expression was determined by FACS. One representative dotplot is shown out of three independent experiments. In vitro chemotaxis of B. vulgatus mpk or E. coli mpk stimulated wild type or IL-6−/−-BMDC towards CCL19 and CCL21 (B). 5×10⁵ BMDC were stimulated with E. coli mpk or B. vulgatus mpk and migration was determined in a 4 h transwell chemotaxis assay. Number of migrated cells of mock controls and B. vulgatus mpk primed DC were normalized to the number of E. coli mpk stimulated cells migrated along the chemokine gradient to the lower compartment. The results are representative for three independent experiments. Each experiment was performed in triplicates, values represent mean±SD. * p<0.05 compared to mock control and B. vulgatus mpk stimulated DC. ** p<0.05 compared to mock control.

