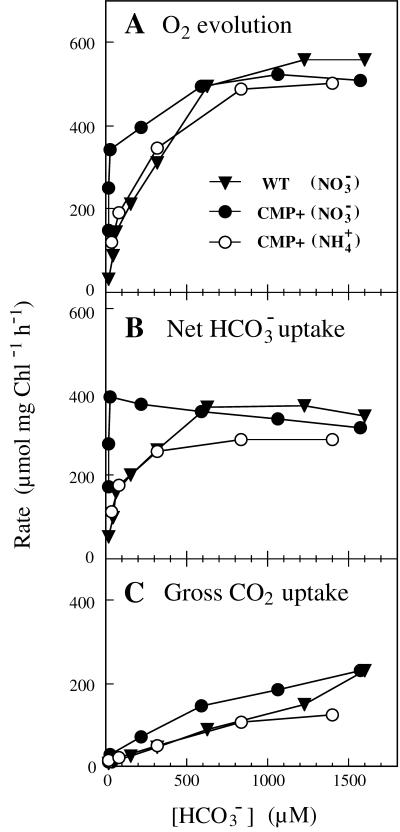
Figure 4.
The rate of O2 evolution (A), net HCO3− uptake (B), and gross CO2 uptake (C) as a function of the HCO3− concentration in medium during steady-state photosynthesis in WT (▾) and the CMP+ mutant (○ and ●). Cells were grown under high-CO2 conditions at a light intensity of 250 μmol of photons m−2⋅s−1 with NH4+ (○) or NO3− (● and ▾) as the nitrogen source. Assays were done at 30°C and pH 8.2.

