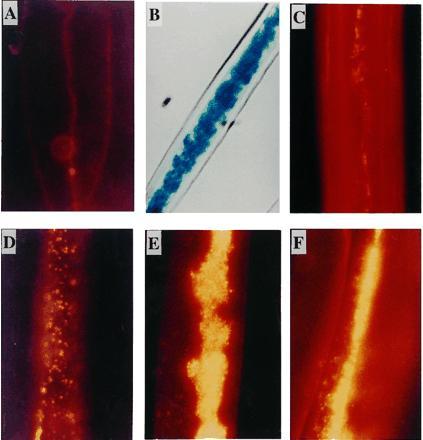
Figure 2.

Epifluorescence microscopy of transgenic fiber. Transgenic (no. 7148) and control DP50 fibers were stained with Nile blue A and subjected to epifluorescence microscopy under excitation wavelength of 546 nm. (A) Control (DP50) 15 DPA fiber. The thin primary walls and lumen are visible. (B) Optical micrograph of transgenic no. 7148 fiber (30 DPA) that was subjected to histochemical staining for GUS to visualize the lumen. (C) Mature DP50 fiber stained with Nile blue A. (D) Transgenic 15 DPA fiber. (E and F) Mature transgenic fibers stained with Nile blue A.
