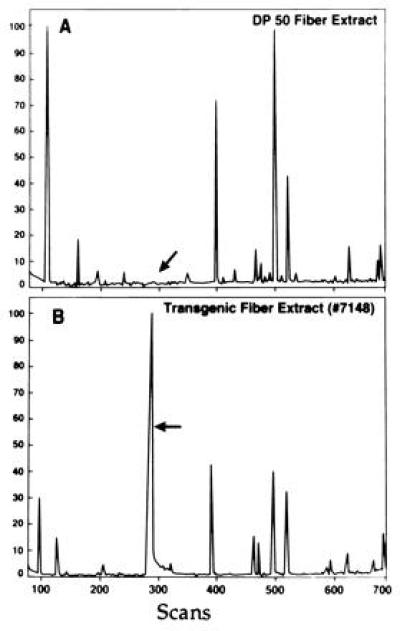
Figure 5.

GC separation of beta-hydroxy acids from transgenic fibers. (A) PHB was extracted as described in the legend for Fig. 4 and redissolved by heating in 0.5 ml of chloroform for 10 min at 100°C. Next, 1.7 ml of ethanol and 0.2 ml of HCl were added and heated at 100°C for 4 h. The mixture was subjected to GC analysis on a Carlo-Ebra GC with an electron impact detector and a DB 5 column (50 meters; Supelco). Scans were taken at 1-sec intervals (700 total). Calibrated range was 17–600 mass units. The GC profile was then compared with that of PHB from A. eutrophus (Sigma) extracted and treated under identical conditions (not shown). The arrow marks the position of the peak present in the profile of PHB from A. eutrophus. Similar peak is not present in DP50 extract. (A) DP50 extract. (B) GC analysis of no. 7148 fiber extract. Arrow marks the peak corresponding to the ethyl ester of beta-hydroxy acid.
