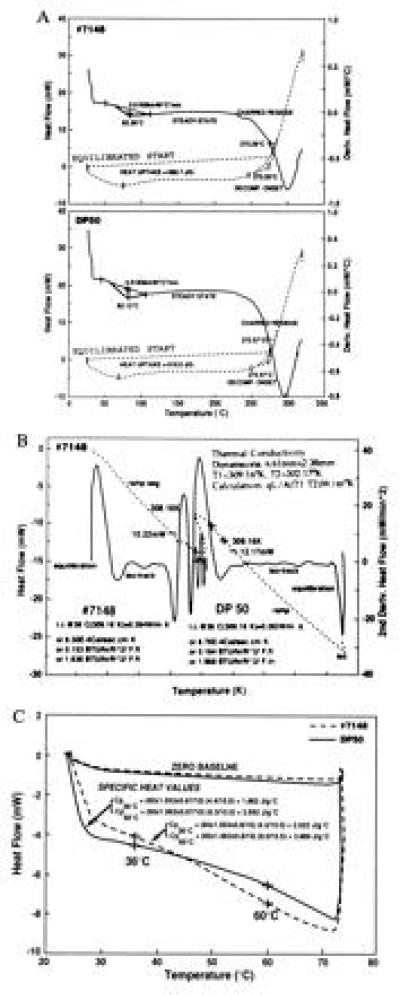
Figure 7.

(A) Heat uptake of transgenic fibers. The heat gain/loss characteristics of fibers were measured by DSC. Sample sizes of 10 mg (no. 7148) and 10.06 mg (DP50) were used. (B) Thermal conductivity measurements of transgenic fibers. The heat flow rate through samples no. 7148 and control DP50 fibers was monitored against temperature using steady-state equilibrium heat flow method. A modified DSC (TA Instruments) was used for the thermal conductivity measurements. Experimental conditions and results are summarized in the figure. All conditions for DP50 were identical to those shown for no. 7148, except: dimension = 6.61 mm × 2.36 mm and T2 = 302.18 K. T1, temperature at the bottom of the sample; T2, temperature at the top of the sample; q, heat flow; L, heat flow path; A, total area of the sample. (C) Comparison of specific heat values of transgenic and control fibers by DSC. Specific heat values were obtained for 36°C and 60°C each. A sample size of 10 mg was used in the DP50 control, whereas 10.5 mg was used for no. 7148. Zero baseline was established by measurement of Sapphire. Cell constant values are E36°C = (0.7978 × 10 × 60.83)/(60 × 0.8 × 9.6) = 1.053. E60°C = (0.8432 × 10 × 60.83)/(60 × 0.8 × 10.05) = 1.063.
