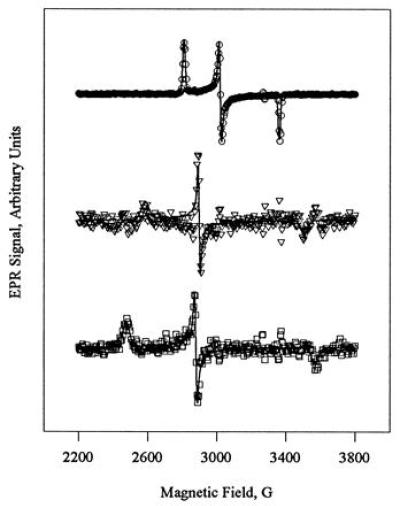
Figure 3.

Simulated EPR spectra (solid lines) of green (Top), quasi-native (Middle), and native (Bottom) ferric CPO, overlaid on the individual component spectra (symbols). The EPR spectra for quasi-native and native CPO were constructed by the digital subtraction of spectra recorded at different times during reactivation of green CPO (Fig. 2). The simulations are based on the parameters in Table 1.
