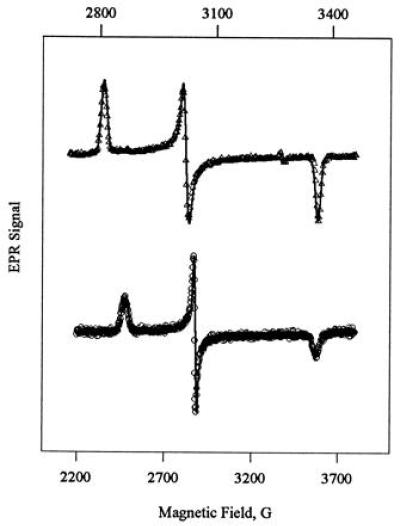
Figure 4.

Simulated EPR spectra (solid lines) of green (Upper) and native (Lower) ferric CPO, overlaid on the measured EPR spectra of freshly prepared green CPO and untreated ferric CPO (symbols). The spectrum of green CPO is shown on an expanded scale (top axis) to illustrate the quality of the fit. Experimental conditions are as given for Fig. 2.
