
Figure 2.
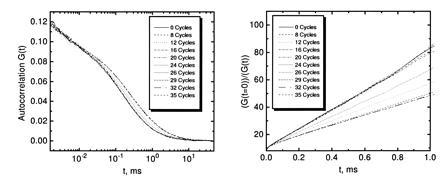
FCS analyses over successive rounds of PCR amplification of a 106-bp segment of IS6110 from M. tuberculosis. A standard PCR mixture with primers S1 and S2 and 104 target genomes in the presence of 50 ng/μl carrier DNA was supplemented with 10 nM probe PR1 to monitor specific amplification by probe extension. (Left) The obtained autocorrelation functions G(t) after the indicated numbers of thermal cycles. (Right) The linearized function [G(t = 0)]/[G(t)].