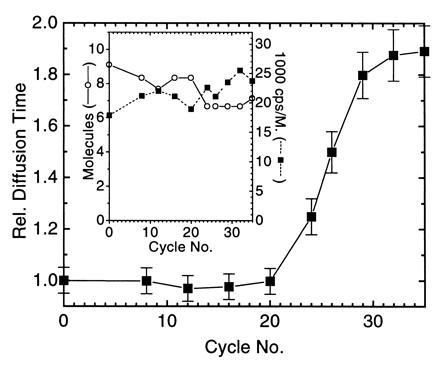
Figure 3.

Extracted relative probe diffusion times of the experiment in Fig. 2. Error bars indicate the deviation in at least two independent FCS analyses of the PCR mixtures. (Inset) Calculated number of molecules in the FCS volume element and the detected photon counts per second (cps) and molecule.
