
Figure 5.
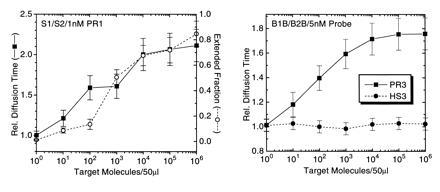
Detection limit of APEX-FCS analysis with M. tuberculosis genomes as target in the presence of 50 ng/μl carrier DNA using two different primer/probe combinations. (Left) Results after 36 amplification cycles using 0.5 μM of each primer S1 and S2 and 1 nM TMR-labeled probe PR1. (Right) Results after 40 thermal cycles using 0.5 μM of each primer B1B and B2B and 5 nM TMR-labeled probe PR3. (Left) Comparison is made between the FCS-analyzed, relative probe diffusion times, and analysis of probe extension using an automated fluorescence sequencer. (Right) FCS analysis is compared for product specific probe PR3 and noncomplementary probe HS3. Error bars represent deviations from at least two independent measurements.