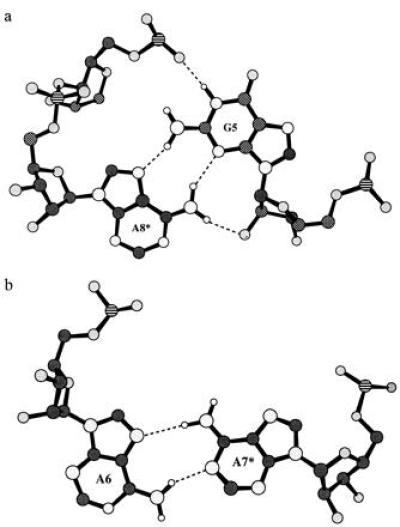
Figure 4.

Structures of the G·A and the A·A base pairs found in this duplex. In these diagrams phosphorous is indicated by a lined pattern, the carbons are shaded dark gray, the oxygens are lighter gray, and the nitrogens are shaded the lightest gray. The hydrogens are shown as unshaded circles in their calculated positions. Dashed lines are used to indicate hydrogen bonding. (a) A G·A base pair viewed perpendicular to the plane formed by the bases. Four interstrand hydrogen bonds are shown, two base–base and two base–backbone, as described in the test. (b) An A·A base pair. Only two base–base hydrogen bonds are formed by this asymmetric pair.
