Fig. 3.
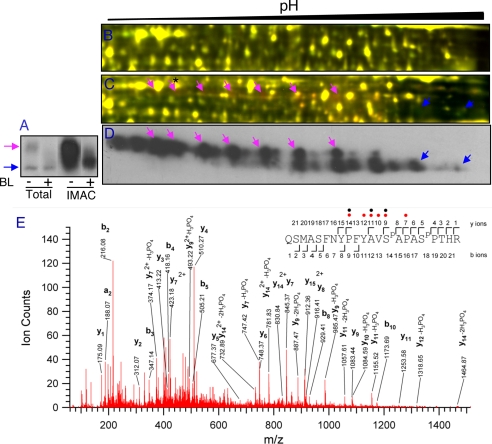
BZR1 protein is detected by 2-D DIGE following IMAC enrichment of phosphoproteins. A, immunoblot of mBZR1-CFP in total protein and IMAC fractions of plants treated with mock solution (−) or 100 nm BL (+) for 2 h using anti-GFP antibodies. B and C, total protein (B) or phosphoprotein fractions (C) were analyzed by 2-D DIGE after labeling BL-treated and untreated samples with Cy3 and Cy5, respectively. D, gel of C was blotted and probed with anti-GFP antibodies. Cyan arrows show the hyperphosphorylated and blue arrows show the hypophosphorylated or unphosphorylated mBZR1-CFP proteins. Matching areas of 2-DE are shown in B–D. E, a spectrum of a BZR1 spot (marked by a star and arrow in C) obtained from a precursor ion with m/z value 863.72033+, corresponding to a double phosphorylated peptide spanning the residues Gln-207 to Arg-228 of BZR1. Phosphorylated residues (Ser-220 and Ser-224) are indicated in the peptide sequence as SP. Phosphate losses are marked with red circles (one loss) or black circles (two losses).

