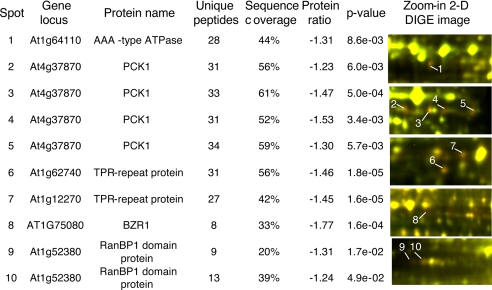
Fig. 4.
BR-regulated phosphoproteins identified in IMAC fractions by 2-D DIGE. Average protein abundance ratios of BR-treated (2 h) to mock-treated and p values of Student's t test were calculated from four biological repeat experiments. In the 2-D DIGE images, proteins down-regulated by BL appear red.

