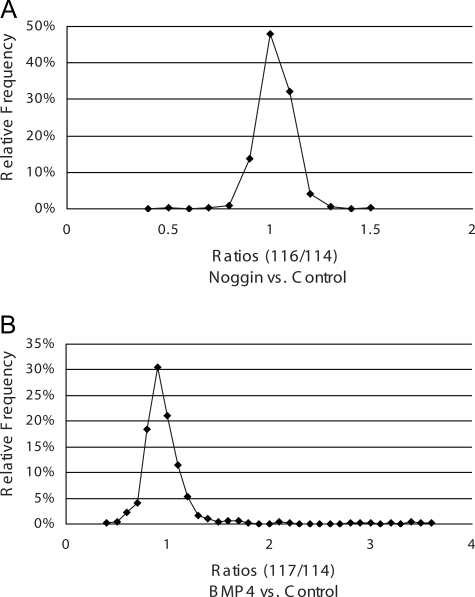
Fig. 4.
Frequency of relative expression ratios using directed protein normalization. Shown is the distribution of relative protein expression ratios for noggin treatment versus control (A) and BMP4 treatment versus control (B). Both treatment conditions show Gaussian distributions indicating very little overall change in differential expression and a shift in the general direction of decreased from control.

