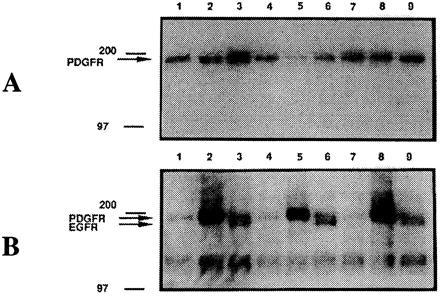
Figure 3.

Sample Western blot analyses for PDGFR and phosphotyrosine-PDGFR. Starved cells were either mock-stimulated (lanes 1, 4, and 7), stimulated with hrPDGF-BB (lanes 2, 5, and 8), or EGF (lanes 3, 6, and 9). Cells were lysed and equal amounts of protein loaded onto a SDS/7.5% polyacrylamide gel. After Western transfer, the blots were tested successively for PDGFR-B (A) and phosphotyrosine (B) analysis. Lanes: 1–3, NIH 3T3; 4–6, RhPV 1 E7; 7–9, RhPV 1 E5. Molecular weight markers in kDa are shown on the left and the receptor locations indicated.
