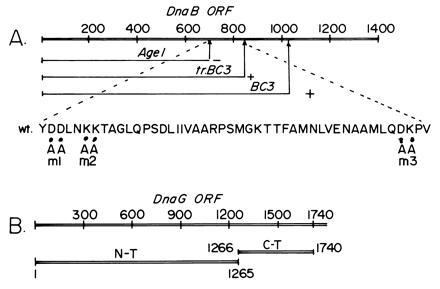
Figure 3.

Maps showing the interaction surfaces that participated in the DnaB–DnaG interaction. (A) Map showing DnaB sequence encoding the AgeI, tr.BC3, and BC3 peptides. The region between the AgeI and tr.BC3 binds to DnaB. The amino acid sequence showing the locations of the m1, m2, and m3 mutants that were used to further narrow down the interaction region. (B) The sequence encoding DnaG showing the locations of 1265-bp-long DNA encoding the N-terminal peptide that did not bind to DnaB and the 475-bp-long sequence encoding the C-terminal peptide that bound to DnaB. The numbers refer to base pair coordinates.
