
Figure 1.
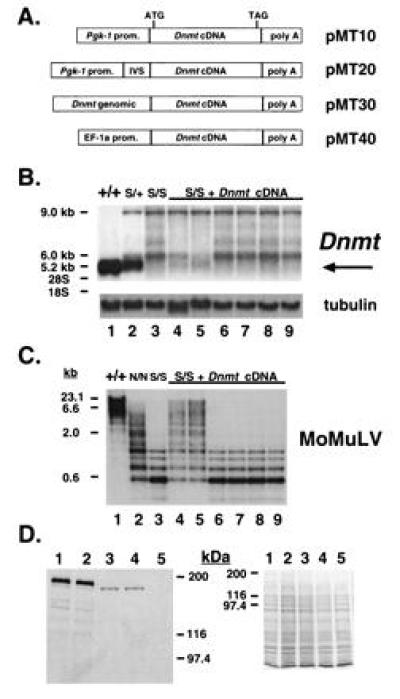
Dnmt cDNA is inefficiently expressed in stable transfections of ES cell lines. (A) Diagram of Dnmt expression constructs. The cDNA used in all four constructs is the same. (B) Northern blot analysis of Dnmt expression in Dnmts/s lines transfected with pMT20 (lanes 4–9). The wild-type Dnmt transcript migrates at 5.2 kb and is indicated by an arrow to the right of the blot. Expression levels are <1% of the wild-type allele in all clones shown, except for lanes 4 and 5, which are 8 and 10%, respectively. Wild-type J1 (lane 1), Dnmts/+ (lane 2), and Dnmts/s (lane 3) cells are shown for comparison. The Dnmt cDNA was used as a probe. The same blot rehybridized with an α-tubulin cDNA (25) to control for amount of RNA loaded is shown also. The bands migrating at 9.0 and 6.0 kb are created by the disruption at the SalI site by a Pgk-Neo cassette and hybridize with a Neo probe (8). (C) Southern blot analysis of HpaII-digested genomic DNA from Dnmts/s lines transfected with pMT20 (lanes 4–9, same order as above). The Moloney murine leukemia virus (MoMuLV) cDNA (26) was used as a probe. Wild-type J1 (lane 1), Dnmtn/n (lane 2), and Dnmts/s (lane 3) cells are shown for comparison. (D) Western blot analysis from Dnmts/s lines transfected with pMT20, which show slight levels of genomic remethylation (lanes 3 and 4 correspond to lanes 4 and 5 in B and C). An amino-terminal anti-MTase antibody was used on the blot to the left and a Coomassie-stained gel is shown as a loading control to the right. Wild-type J1 (lane 1), Dnmts/+ (lane 2), and Dnmts/s (lane 5) cells are shown for comparison. Bio-Rad silver stain molecular weight markers are shown to the side.