Figure 3.

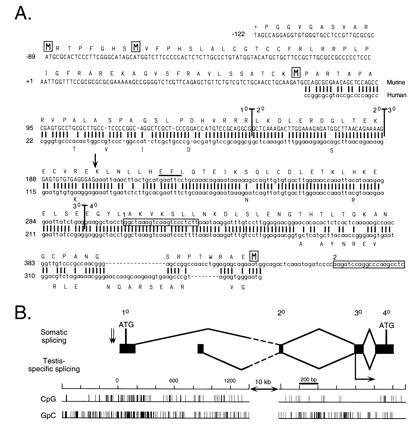
Complete Dnmt cDNA contains two additional 5′ exons that extend the ORF by up to 171 codons. (A) Comparison between murine and human Dnmt sequences at the 5′ end. New sequence reported in this paper is shown in uppercase type and the previously reported sequence is in lowercase type. The first two rows of sequence are genomic sequence, while the five rows beneath represent cDNA sequence. A previously reported human cDNA (31) is shown beneath the murine sequence with all matches represented by a vertical bar. A predicted translation of the 182-codon extension of the ORF is shown above the murine nucleotide sequence, starting with the stop codon TAG and with the four methionine residues boxed. Differences in the human amino acid sequence are represented beneath the human nucleotide sequence. Vertical bars running through the murine sequence denote exon–exon boundaries, with the numbers corresponding to the exon designations used in B. The two boxed sequences represent the primers MMT2214AS (box 1) and MMT2363AS (box 2) used in the cloning experiments. The EcoRI site that marks the beginning of the Dnmt cDNA used in the expression constructs in Fig. 1 is indicated by a bar over the recognition sequence. The major transcriptional start site found by Rouleau et al. (15) is indicated by a vertical arrow. (B) Map of exonic structure of the 5′ end of Dnmt. The first four exons of Dnmt are represented to scale with respect to their size and relative position in the gene. Exon numbers described in text are given above. The splicing of the first four exons of Dnmt is diagrammed above, while the alternative splicing observed in mouse testis (N. B. Kuemmerle, L. E. Halce, and K. Valerie, unpublished work) is shown below. The numbering of the nucleotide scale starts with 0 as the 5′ end of the new cDNA sequence. The two alternative exons are separated from the second common exon by a 10-kb interval of genomic DNA, indicated by the broken lines in the splicing diagram. CpG and GpC incidence diagrams are plotted below to scale with the rest of the diagram. The two 3′-proximal ATGs indicated by a boxed M in A are shown in their genomic locations, while the first two ATGs are indicated by vertical arrows to the left of exon 1. The major transcriptional start site found by Rouleau et al. (15) is indicated by a horizontal arrow below exon 3.
