
Figure 4.
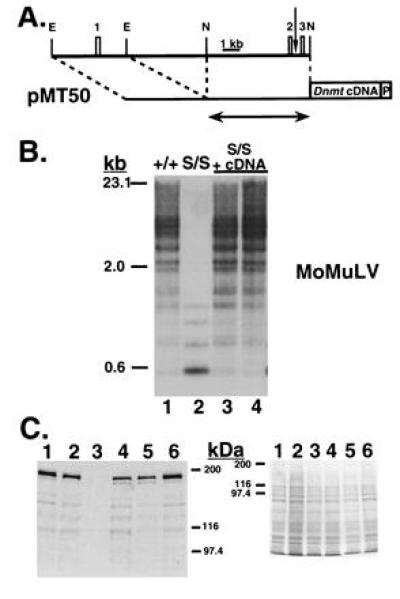
Restoration of normal genomic DNA methylation levels upon expression of the full-length Dnmt cDNA. (A) Map of pMT50, showing its relation to Dnmt genomic sequence and the exons therein (drawn to scale). The first three exons of Dnmt are represented by numbered boxes and correspond to those shown in Fig. 3B. The vertical arrow represents the transcriptional start site reported in Rouleau et al. (15). EcoRI (E) and NaeI (N) sites used in cloning are indicated. The Dnmt cDNA and Pgk-1 polyadenylylation signal (P) are both represented by boxes. The amount of Dnmt genomic sequence used in pMT30 is shown beneath by the arrow. (B) Southern blot analysis of HpaII-digested genomic DNA, probed with the MoMuLV cDNA. Wild-type J1 (lane 1) and Dnmts/s cells (lane 2) are shown, followed by pMT50-transfected Dnmts/s cells (lanes 3 and 4). (C) Western blot analysis of the pMT50-transfected cells shown in B (lanes 4 and 5). An amino-terminal anti-MTase antibody was used in the blot on the left and a Coomassie-stained gel is shown as a loading control on the right. Wild-type J1 (lanes 1 and 6), Dnmts/+ (lane 2), and Dnmts/s (lane 3) cells are shown for comparison. Bio-Rad silver stain molecular weight markers are shown to the side.