
Figure 3.
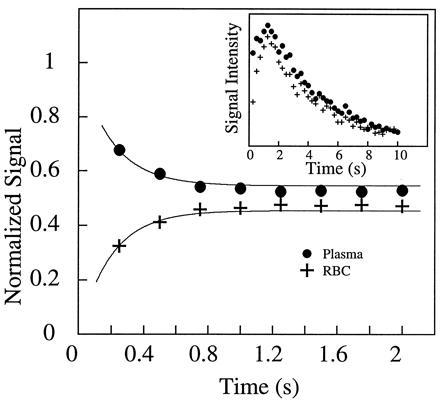
The mixing of xenon between the blood and the saline solution. By using short rf pulses of small tipping angle, 129Xe NMR spectra were acquired as a function of time after injection of the xenon/saline solution into the blood. The main figure shows the time dependence of the xenon signal in the RBC and in the saline/plasma, normalized by the total signal. Within the first second, the rise of the RBC signal and the reduction of the saline/plasma signal describe the dynamic process of xenon entering the RBC from the saline/plasma during mixing. From the exponential fits (shown as solid lines), the time scale for this process is estimated to be about 200 ms. (Inset) The time dependence of the integrated xenon signal from both peaks in the spectra. From the decay starting after 2 s, the T1 of the two components is found to be 5.0 s. The initial rise in the total xenon signal intensity during the first second, following the vigorous injection and mixing of the xenon/saline solution, is most likely caused by xenon-containing blood/saline mixture descending from the walls of the sample tube into the region of the detection coil. NMR experiments were performed on a Bruker AM-400 spectrometer.