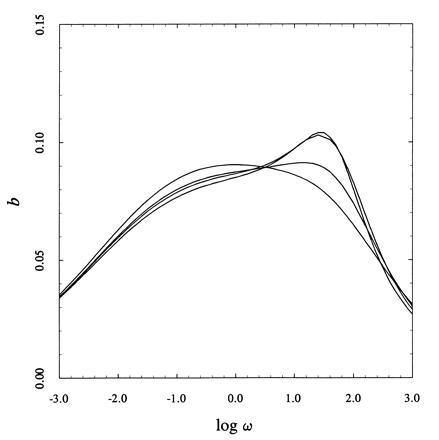
Figure 6.

Binding capacity per site b = d2 ln Ψ/d ln ω2 for two-dimensional lattices (from left to right: 4×4, 6×6, 7×7, 10×10) with σ = 0. The bimodal profile of the binding capacity becomes increasingly asymmetric as N increases and mimics the behavior of a system composed of two classes of sites, with the low affinity sites being more populated. This behavior is typically seen in the interaction of ligands with receptors on the cell membrane (19).
