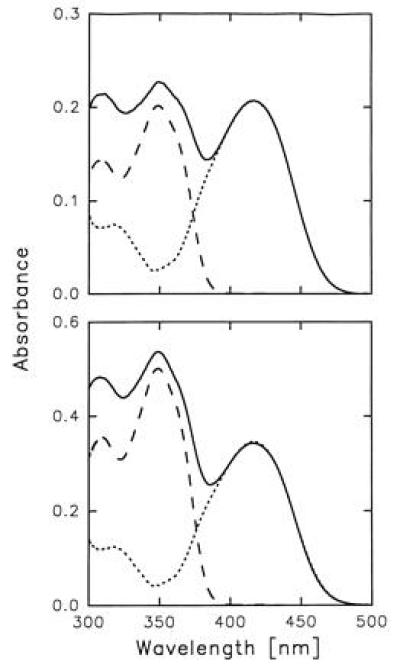
Figure 2.

Absorption spectra of HSA–3-HF complexes at 298 K. (Upper) [HSA] = 40 μM, [3-HF] = 40 μM; (Lower) [HSA] = 40 μM, [3-HF] = 80 μM. Decomposition of the absorption spectra into the two components corresponding to the two ionic forms of 3-HF is shown by --- for 3-HF normal tautomer; and ··· for 3-HF anion.
