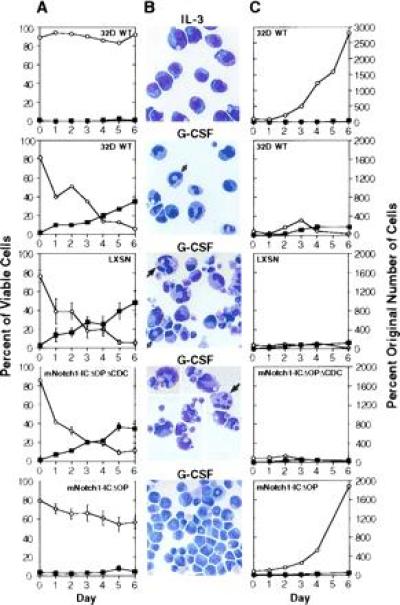
Figure 2.

Effect of activated mNotch1 expression on the differentiation and proliferation of 32D cells. The parental 32D line (WT) and 32D cells transduced with the pLXSN retrovirus, pLXSN containing the active region of the intracellular domain of mNotch1 (mNotch1-ICΔOP), or a pLXSN-mNotch1 control lacking the cdc10 repeats (mNotch1-ICΔOPΔCDC) were evaluated for growth and differentiation in response to G-CSF. This figure represents one of four experiments, all having comparable results. (A) The relative percentages of viable cells remaining undifferentiated (○) or showing morphologic characteristics of mature granulocytes (▪) after successive days in culture. Plots for the retroviral lines represent the averages of four (LXSN) or six (mNotch1-ICΔOP and mNotch1-ICΔOPΔCDC) individual clones. Error bars = SEM for each set of clones; error bars are not included on the WT graphs since these represent a single population. (B) Representative Wright-stained cells. IL-3, undifferentiated parental 32D (WT) cells maintained in medium containing 10% WCM as a source of IL-3; G-CSF, 32D WT cells and representative clones expressing pLXSN, pLXSN-mNotch1-ICΔOPΔCDC or pLXSN-mNotch1-ICΔOP after 6 days in medium containing 1% WCM and 10 ng/ml G-CSF. The cells depicted in the second and fourth panels (32D WT and mNotch1-ICΔOPΔCDC) represent a single field condensed by deleting vacant areas to show a greater number of cells. The white and black arrows indicate band forms and segmented neutrophils, respectively. (C) The proliferation of undifferentiated cells (○) and mature granulocytes (▪) after successive days in culture with IL-3 (32D WT, Upper) or G-CSF. The total number of undifferentiated cells and mature granulocytes relative to the original number of cells plated are compared for the 32D parent line (WT) and each set of retroviral clones. Again the graphs represent the averages of four (LXSN) or six (mNotch1-ICΔOPΔCDC and mNotch1-ICΔOP) clones. SEMs were small; error bars are not depicted for the sake of clarity and would not change the impression created by the figure. Cells showing some characteristics of differentiation, but which were less mature than band cells were not included in either the undifferentiated or mature categories.
