
Fig. 2.
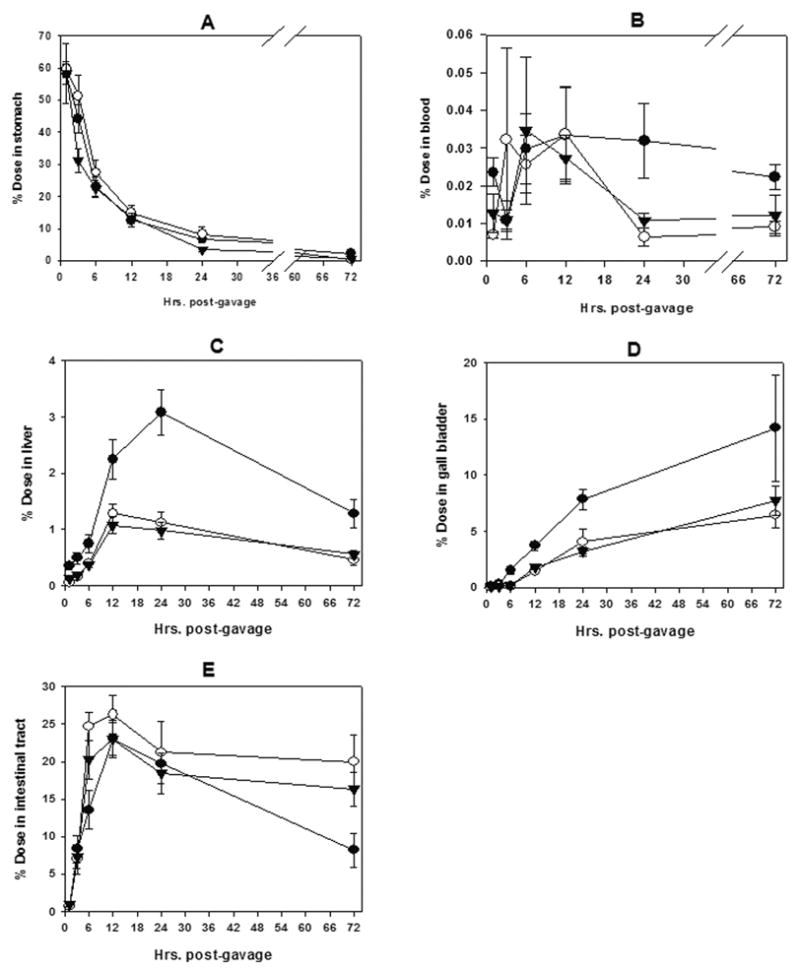
Pharmacokinetics of 200 μM [14C]-DBP following oral gavage treatment of 0.02 μCi/g body weight. Chemoprotective treatments included 2 mM chlorophyllin or 2 mM chlorophyll. Ten fish were killed at each time point after gavage Samples of each tissue were individually collected, processed and evaluated by liquid scintillation counting for 14C activity. Data from the pyloric cecae and the lower intestine were combined into one compartment termed the intestinal tract. ● = DBP, ○ = DBP + chlorophyllin, ▾ = DBP + chlorophyll. Each data point represents mean ± SE of the 10 samples.