
Figure 1.
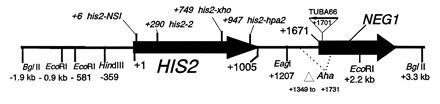
Map of the HIS2 gene and surrounding region. Features shown are those used in the experiments described in this paper. All locations are numbered relative to the A of the first ATG of the HIS2 coding region (designated +1). The arrow indicates the direction of transcription. The location of the downstream gene (NEG1) is also shown.