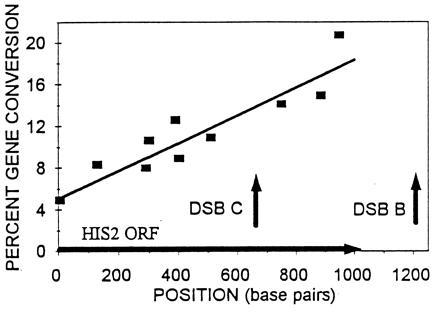
Figure 6.

Map of DSBs relative to conversion gradient. Data for conversion comes from ref. 14, except for the his2-hpa2 allele. The arrow on the x-axis represents the HIS2 coding region. The least squares line has a correlation coefficient of 0.85. Vertical arrows represent the position of the DSBs.
