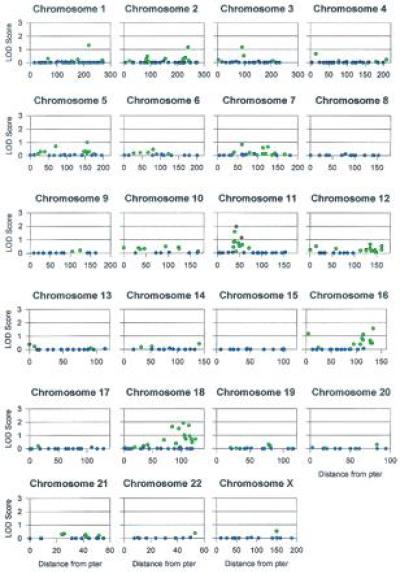
Figure 2.

The lod scores for the maximum likelihood estimates (MLEs) of θ in the combined sample for the 473 microsatellite markers typed in the genome screen. The MLEs of θ are represented by different colors: red, θ < 0.10; green, 0.10 ≤ θ < 0.40; blue, θ ≥ 0.40. Note that the scale for the x-axis (distance from pter in cM) changes with chromosomes. Marker names and actual MLEs of θ are available from N.B.F. by request.
