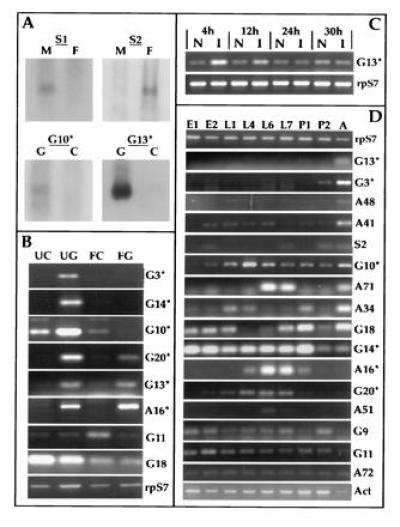
Figure 2.

mRNA expression analysis of differentially amplified fragments. (A) Northern analysis of adult sex and gut-specific differential display fragments. The female-specific clone S2 as well as amplicon S1 were hybridized to filters containing RNA isolated from unfed females (F) and males (M). The gut-specific clones were hybridized to filters containing RNA from fed (24 h) midguts (G) and remaining carcasses (C). (B) RT–PCR analysis of gut specific and blood meal modulated expression, comparing unfed midguts (UG), carcasses (UC), blood-fed midguts (FG) and carcasses (FC) 22 h postfeeding. cDNA clones are identified on the right margin with asterisks, indicating those shown in Fig. 3. Levels of ribosomal protein S7 RNA were used as control. (C) RT–PCR analysis of G13 mRNA levels in bacterially challenged larvae versus naive larvae at 4, 12, 24, and 30 h following infection. (D) RT–PCR expression analysis comparing RNA from embryos (E1 = 0–24 h; E2 = 28–46 h), larvae (L1 = 0–25 h, L4 = 4 days, L6 = 6 days, L7 = 7 days), pupae (P1 = early and P2 = late), and adult females (A). Ribosomal protein S7 (15) and cytoskeletal actin (16) mRNA levels were used as controls.
