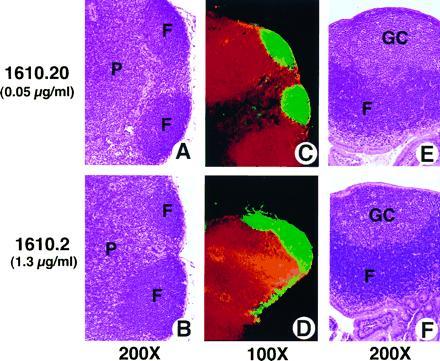
Figure 2.

Normal architecture of lymph nodes and Peyer’s patches from LTβR–Fc-expressing mice. Tissue sections of lymph node (A–D) and Peyer’s patch (E and F) from either low-expressing (A, C, and E), or high-expressing (B, D, and F) 6-week-old female LTβR–Fc transgenic mice (1610.2 and 1610.20 from Table 1). Tissue sections were stained with either hematoxylin/eosin (A and B, E and F) (×200), or with antibodies specific for T-cell (anti-CD4, red) and B-cell (anti-B220, green) antigens (C and D) (×100). Yellow staining indicates colocalization of both T and B cells. F, P, and GC indicate the location of the B-cell-rich follicles, the T-cell-rich paracortex, and the germinal centers, respectively.
