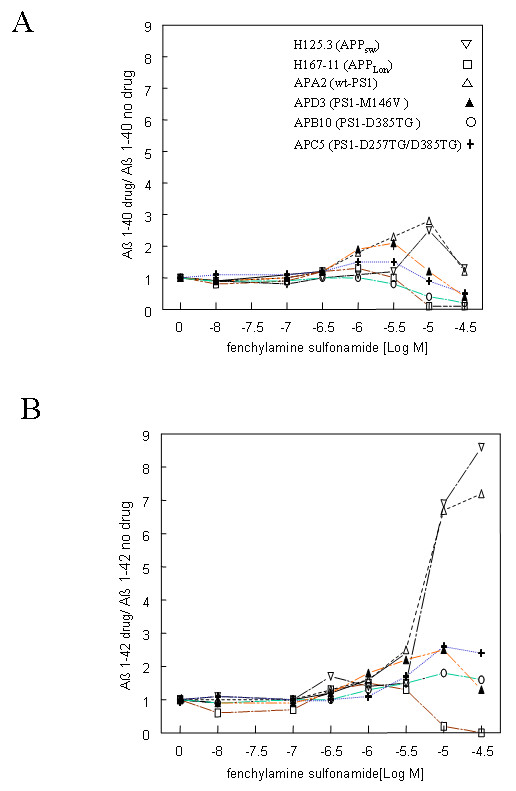
Figure 3.

The relative Aβ level secreted in the various stable cell lines treated with fenchylamine sulfonamide. Aβ40 (A) and Aβ42 (B) were measured by ELISA 24 hours post treatment with the γ-secretase inhibitor fenchylamine sulfonamide (n = 2). The untreated samples were used for normalization. The symbol for each cell lines is the same as in Figure 2.
