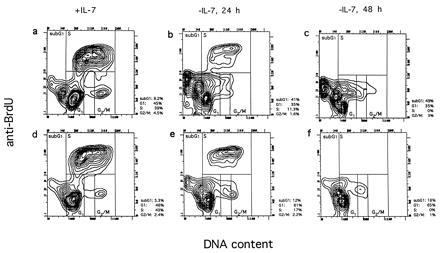
Figure 3.

Cell cycle profiles of an abl-deficient (a–c) and a control line (d–f) in the presence of IL-7 and after IL-7 withdrawal for 24 (b and e) and 48 h (c and f). Cells were labeled with BrdU during the last 30 min of culture and subsequently stained with anti-BrdU antibodies and propidium iodide and analyzed by fluorescence-activated cell sorter (see Materials and Methods). The percentage of cells in G0/G1, S, G2/M, and sub-G1 are shown to the right of each plot. The cell population that occurs after IL-7 withdrawal to the right of the G1 population and stretches toward the G2/M population may represent cells that underwent apoptosis in S or G2/M. Because they extend into the G2/M and G1 gate, the percentages for G2/M and G1 may be overestimated.
