
Figure 4.
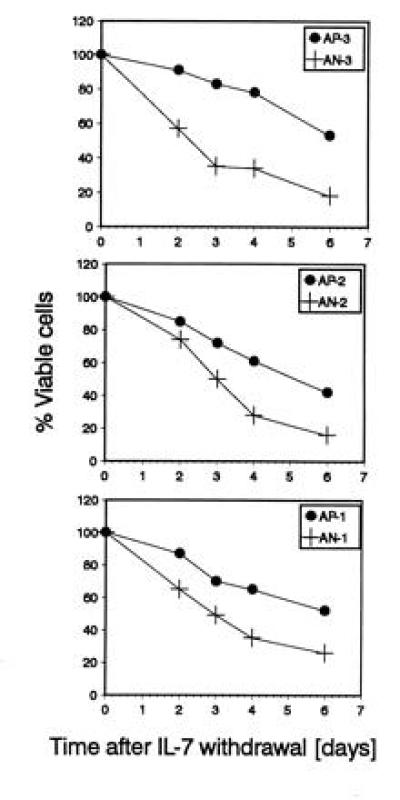
Viability of abl-deficient and control lines after IL-7 deprivation. The percentage of viable cells was determined by trypan blue exclusion at different time points after IL-7 withdrawal. Each blot compares the viability of an abl-deficient line to a control line generated from littermates. Abl-deficient lines (+) show a lower viability than their control lines (•). For each data point, duplicate cultures were analyzed. The SD was ≤5%. One of two experiments with similar results is shown.