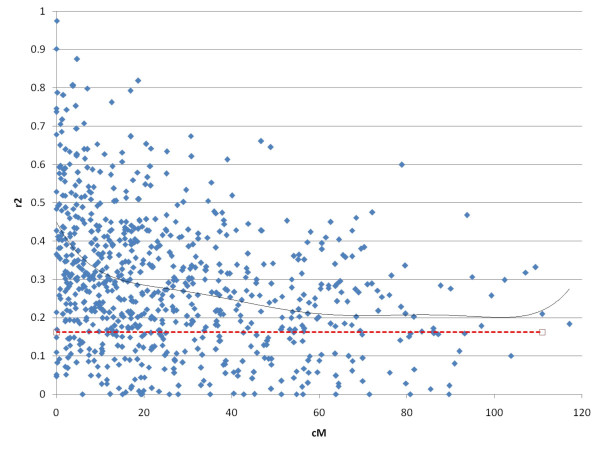
Figure 5.
Levels of LD between microsatellite-SNP pairs located on the same linkage group plotted versus genetic distance. SNPs with minor allele frequencies < 0.20 and microsatellites with heterozygosity < 0.50 were excluded. Full line = 6th degree polynomial best fit to the data; broken line = average level of LD between physically unlinked markers (for comparison).

